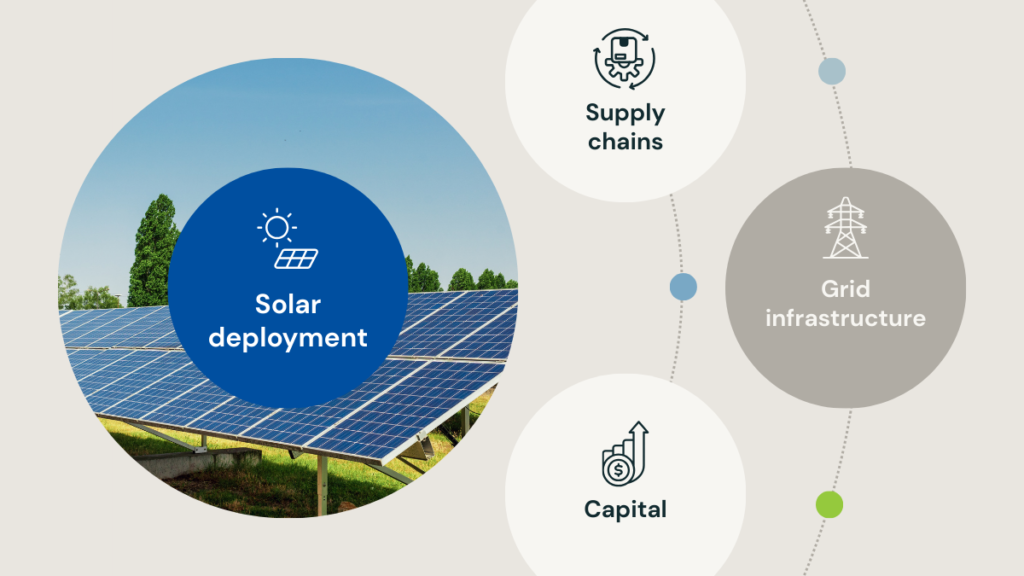
Raw MW figures are helpful, but they miss something deeper: the capacity pipeline is a structural signal about where solar will actually shape industrial and economic power. It’s not enough to build panels — a country needs supply chains, capital, grid infrastructure, and skilled labor to convert capacity into resilient decarbonised economies.
In other words, the global solar map is not just a chart of panels. It is a map of where value and leverage in the energy transition are consolidating.
This matters for investors, policymakers, and planners precisely because:
- Solar deployment without integrated supply chains often stalls at grid bottlenecks.
- Capital follows policy certainty — not just climate rhetoric.
- Markets that combine installation capacity with manufacturing scale will capture more of the economic upside of the energy transition.
If the solar transition means anything at scale, it is not simply reducing emissions. It is about who anchors energy and industrial competitiveness in the coming decades.